Credit & Copyright: The Galileo Project,
NASA
Explanation:
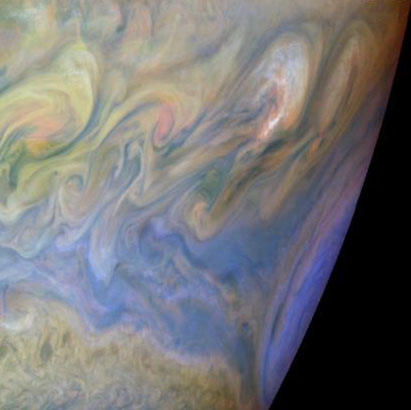
The turbulent region West of Jupiter's Great Red Spot is highlighted in
this picture constructed from data recorded by the
Galileo spacecraft.
The image is color coded to show
cloud height and thickness;
white clouds are high and thick,
light blue clouds are high and thin, and
reddish clouds are low.
The edge of the
Red Spot
itself appears blue here
(lower right) and spans about
10,000 kilometers along the curving limb of the planet
(north is up).
Westward winds,
deflected north by the circulation within
the Great Red Spot, collide with
Eastward winds at higher latitudes and generate the roiling,
Turbulent structures.
The largest
eddies
near the Northwestern edge of the
Red Spot are
bright, suggesting upward convection and high altitude
cloud formation are taking place there.
1999 2000 2001 2002 2003 2004 2005 2006 2007 2008 2009 2010 2011 2012 2013 2014 2015 2016 2017 2018 2019 2020 2021 2022 2023 2024 2025 |
Январь Февраль Март Апрель Май Июнь Июль Август Сентябрь Октябрь Ноябрь Декабрь |
NASA Web Site Statements, Warnings, and Disclaimers
NASA Official: Jay Norris. Specific rights apply.
A service of: LHEA at NASA / GSFC
& Michigan Tech. U.
|
Публикации с ключевыми словами:
Jupiter - Great Red Spot - Юпитер - Большое Красное Пятно - ураган
Публикации со словами: Jupiter - Great Red Spot - Юпитер - Большое Красное Пятно - ураган | |
См. также:
Все публикации на ту же тему >> | |
